Technical Analysis Education with AI: Reinforcing What We Learn in Books 📈🤖
This study is designed to repeat and better understand technical analysis concepts on a chart for educational purposes.
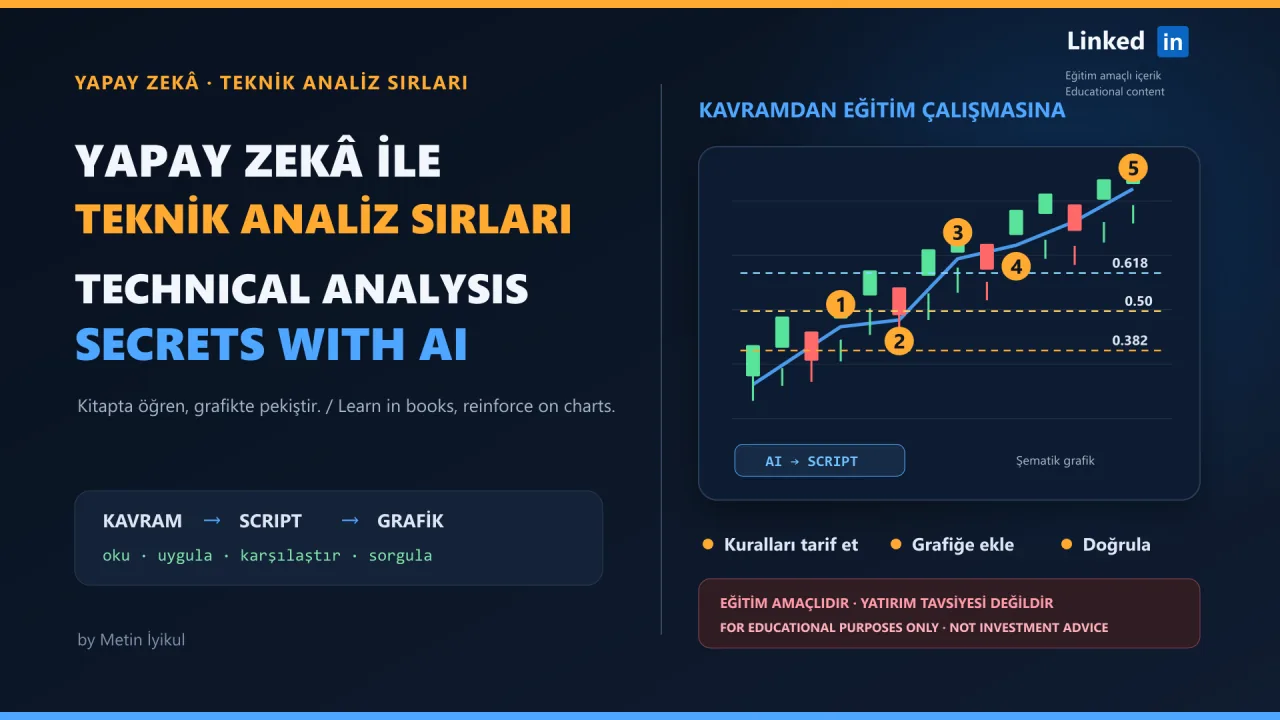
⚠️ EDUCATIONAL STUDY ONLY: This article does not guide investment decisions. No chart, drawing, or mark created by AI should be used to invest money. AI can make mistakes. Every decision and all responsibility belong to the user.
Until now, this article series has focused on how AI can make our work easier. We prepared bank instructions from proformas, downloaded customs documents, and built a desktop tool to follow the Turkish Official Gazette. In short, we automated repeated work and saved time.
But AI is not limited to automation software or ERP-like products. Sometimes it can turn a method we learned into a personal study tool for education. Today's example is reinforcing technical analysis concepts on TradingView.
Imagine that you become interested in stocks, ETFs, or funds. You do not know technical analysis, so you buy a book and watch some videos. You learn new terms: support and resistance, moving averages, Fibonacci retracement, RSI, and Elliott Waves. Everything looks clear while you are reading.
Then you open TradingView with excitement and go to the chart of a stock. You select the Fibonacci tool, but you are not sure where to start or finish. You try to mark Elliott Waves. Where did Wave 1 end? Is Wave 2 really a correction, or was the first count already wrong? After adding and deleting many lines, the chart becomes difficult to read.
This is the point where many beginners start to dislike technical analysis. But we do not need to give up. AI can enter the process, not to move documents this time, but to turn what we learned into a working chart tool.
📉 The Problem Is Not Learning the Terms; It Is Turning Them Into a Chart
A book explains a concept. The screen asks you to turn that concept into a rule. What exactly is an “important low”? How many candles should we check? Which confirmed high and low should define the Fibonacci range? What conditions make a wave valid?
The human eye often answers these questions with intuition. But if we want to repeat the same analysis, intuition is not enough. We need clear rules. This is where AI becomes useful: it can turn the method in our mind into rules that can be coded, adjusted, and reused.
🤖 What Does AI Do Here?
Instead of asking AI, “Which stock should I buy?”, we say: “I want to work with these concepts. How can we make them visible on the chart?”
We open the script editor in TradingView. We describe the timeframe, indicators, colors, sensitivity settings, and drawing rules. AI prepares a script draft. We add the code to the editor, fix the errors, save it, and apply it to an educational chart. Then we can study the levels and candidate labels created by our rules directly on the candles.
The purpose is not to believe that AI knows the market. The purpose is to translate our description into a language TradingView understands and study how the rules from a book look on a chart.
🧩 What Should We Tell AI?
“Write technical analysis code for me” is too broad. We need to describe the limits of the task. For example:
“Create an educational script for TradingView that works on top of the candles. Find the last confirmed swing low and swing high with a sensitivity setting the user can change. Draw the 0.382, 0.50, and 0.618 Fibonacci levels between these points. Show the 20- and 50-period moving averages. For Elliott Waves, label only candidate turning points that match the rules as 1-2-3-4-5; do not present them as a certain wave count or an investment signal. Add explanations so we can check whether old marks change later.”
This prompt does not guarantee a perfect indicator. But it turns a vague request into a draft we can check. We can look at the chart, explain the wrong marks, and improve the code step by step.
🛠️ From Idea to Chart in Five Steps
1. Choose one method. Do not ask for everything at once. Start with a narrow scope, such as swing points and Fibonacci.
2. Write the rules. Define the timeframe, candle count, levels, colors, and the conditions for a label.
3. Create the script draft. Ask AI to use clear variable names, user settings, and explanation lines.
4. Test it in the script editor. Add the code, run it, and apply it to the chart. If there is an error, give the exact error message to AI.
5. Verify it only for education. Study why the marks appear on different historical charts and timeframes. Do not use this work to invest real money or to create buy and sell signals.
⚠️ The Most Important Line: The Tool Is Not the Decision
Some parts of technical analysis are open to interpretation. Fibonacci levels change when you choose different start and end points. Two experienced analysts can count Elliott Waves differently on the same chart. So AI labels are not “the truth.” They are only candidates created by the rules you defined.
Also, a beautiful historical chart does not guarantee the same result in the future. Some indicators can change old signals when new data arrives. This is called repainting. Some tests can also look too successful because they accidentally use information that was not available at the time. Following green and red marks without understanding the code is like driving a car we do not know.
AI does not replace professional investment advice, fundamental analysis, or risk management. The only purpose of this study is to reinforce what we learn in technical analysis books by repeating it on a chart. Do not invest by trusting AI. Every user must do independent research and accept responsibility for every decision.
🎯 The Bottom Line
AI does more than build programs that automate our work. It can also close the distance between a concept we learn in a book and a tool we can use on screen.
Yesterday we were unsure where to place a Fibonacci line. Today we can describe our rules and build our own indicator. We spend less time fighting the drawing tools and more time understanding the method and testing our ideas.
The purpose is not to memorise every script line or receive investment signals from AI. The real task is to see a concept from a book again on a chart, understand the rule behind it, and know where the result can be wrong.
Which concept would you first study on a chart to reinforce your technical analysis education: Fibonacci levels, support and resistance zones, or moving averages? Let us discuss it in the comments.
⚠️ FINAL REMINDER - FOR EDUCATIONAL PURPOSES ONLY: This example was prepared only to reinforce the explanations in technical analysis books. AI output can be wrong or misleading. Do not invest money or make investment decisions based on these charts. Every investment decision and result is the user's own responsibility.